




Bitcoin derivatives market data.

Track live BTC price, exchange volume, dominance, volatility, futures open interest, funding rates, liquidations, and historical Bitcoin market data.

Bitcoin market data

Spot, leverage, and history in one market view

Read price, exchange activity, futures open interest, funding, liquidations, and historical series without splitting the market story across separate product pages.

Market question

Read price with volume

Read Bitcoin price and traded volume together. Switch from a clean price overview to candlesticks, choose your interval, and inspect the activity behind each move.
Market data
Bitcoin / USDPrice + volume
09:0012:0015:00

Research questions

Questions analysts ask

Short answers backed by live Newhedge data, with links into the underlying chart when it matters.

Questions Newhedge answers

02

How much Bitcoin trading volume is moving?

Bitcoin trading volume is $3.54B across tracked exchanges, including Binance logoBinance, Coinbase logoCoinbase, and OKX logoOKX.

05

Can I pull historical Bitcoin market data?

Yes. Newhedge logoGET /api/v2/price/historical returns historical BTC price, and supported metric endpoints provide historical market series.

What to watch

Compare exchange activity

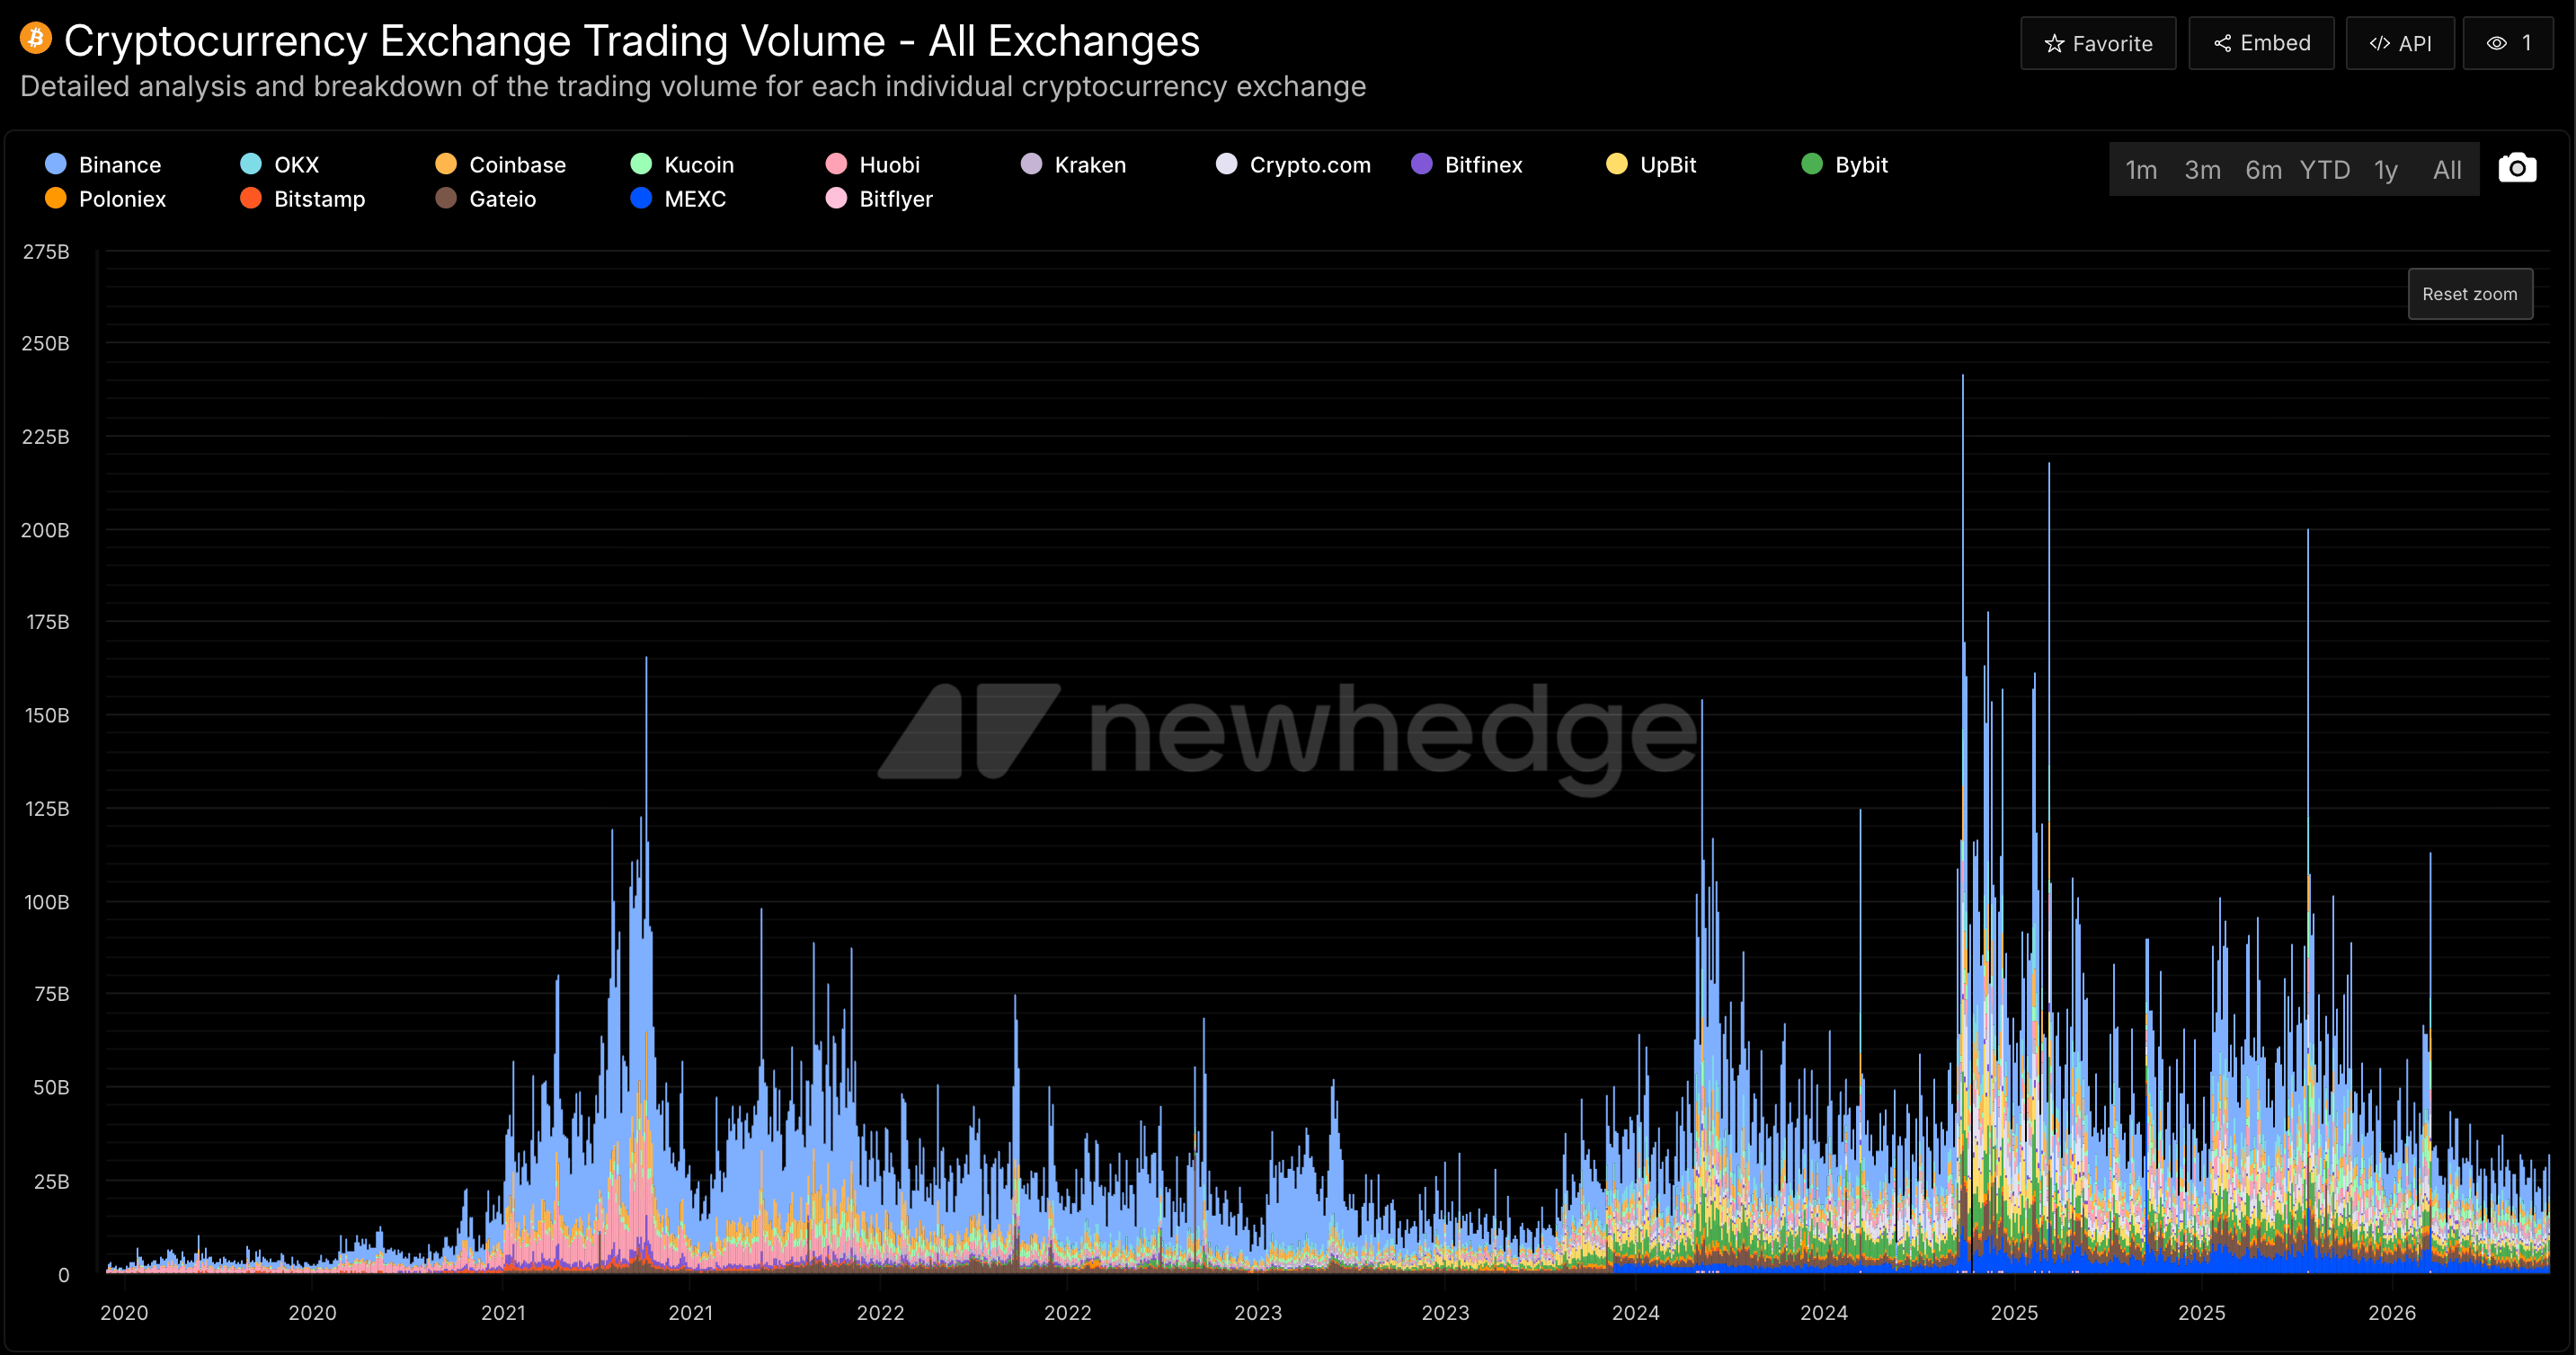
Compare exchange activity over the same period. Volume shows where trading is concentrated; open interest, funding and liquidations add the derivatives context around spot price.
Market data
Compare exchange activityRelative volume
Coinbase
Binance
OKX
Kraken
Bybit
Same periodExchange volume

Use the data

Move from chart to workflow

Open the live view, set an alert, export the series, or query the data through API and MCP access.

Market structure workspace

Read spot activity beside leverage.

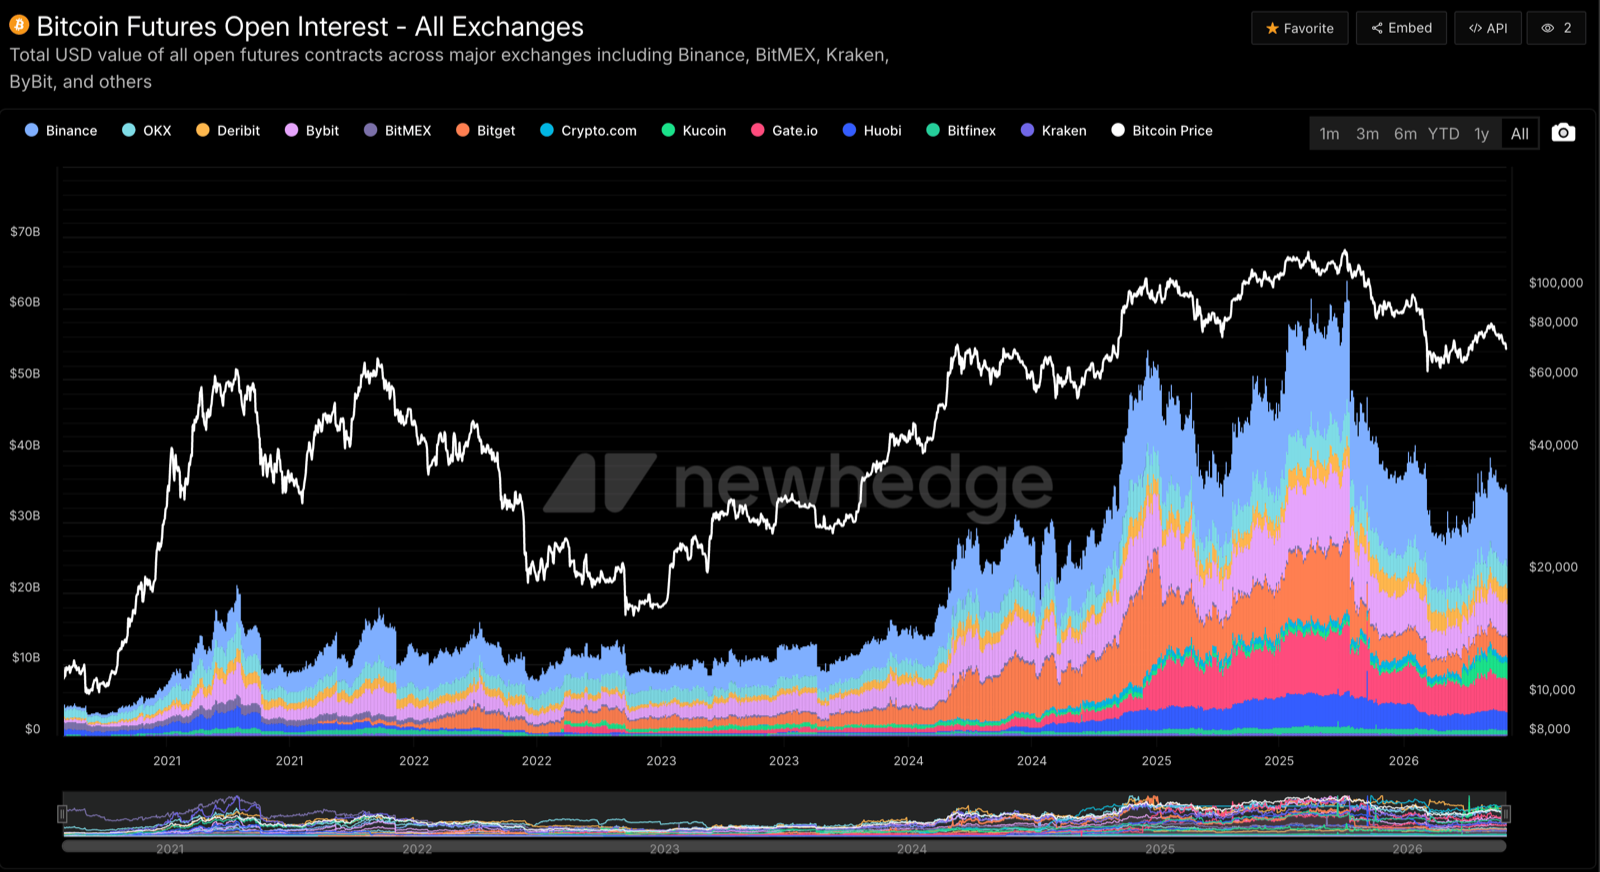
Exchange volume, BTC price, dominance, volatility, futures open interest, funding, liquidations, and historical series show what is moving the market.
Bitcoin Derivatives Market Data
Newhedge cryptocurrency exchange trading volume chart
Newhedge Bitcoin futures open interest chart
BTC volume Coinbase
Global volume Binance
Market share OKX
Spot activity Kraken
BTC markets Bybit

Live context

Add context to every move

Add moving averages, momentum indicators and Newhedge data to the price chart. A shared timeline helps you compare a price move with the signals around it, then look back through history.
Market data
Inspect every layer at the same momentSep 21 · daily candle
BTC close$86,42720D average$83,910RSI (14)61.7
RSI (14)Sep 18Sep 19Sep 20Sep 21
PriceMoving averageMomentum

Decision point

Put the chart to work

Save the chart setup you use, set an alert at a research level, or export the history. Use the API when you want the same data in your own analysis.
Market data
Turn a chart observation into a workflowSaved research
BTC / USD · 1DPrice above 20D averageRSI 61.7
01Save layoutPrice + MA + RSI✓
02Create alertBTC crosses $88,000✓
03Export historyCSV · daily observations↓

See the Bitcoin market before opening another chart. Connect live Bitcoin price, volume, dominance, volatility, and exchange activity so teams can tell whether a move has real support.

Price Live Bitcoin market baseline
Volume Exchange activity context
Alerts Move from signal to monitor
Bitcoin market data

Open Bitcoin derivatives market data.

Use price, volume, volatility, futures open interest, funding, liquidations, and history as the market baseline for Bitcoin research.